Facebook Ads CTR Benchmarks in 2026: What Counts as 'Good' By Industry (Real Data)
The 2026 Facebook ads CTR benchmark sits at 1.44% average across industries, but the spread is enormous. Here's the data by industry, why the 'good CTR' number from 2023 will get you laughed at, and the levers that actually move it.
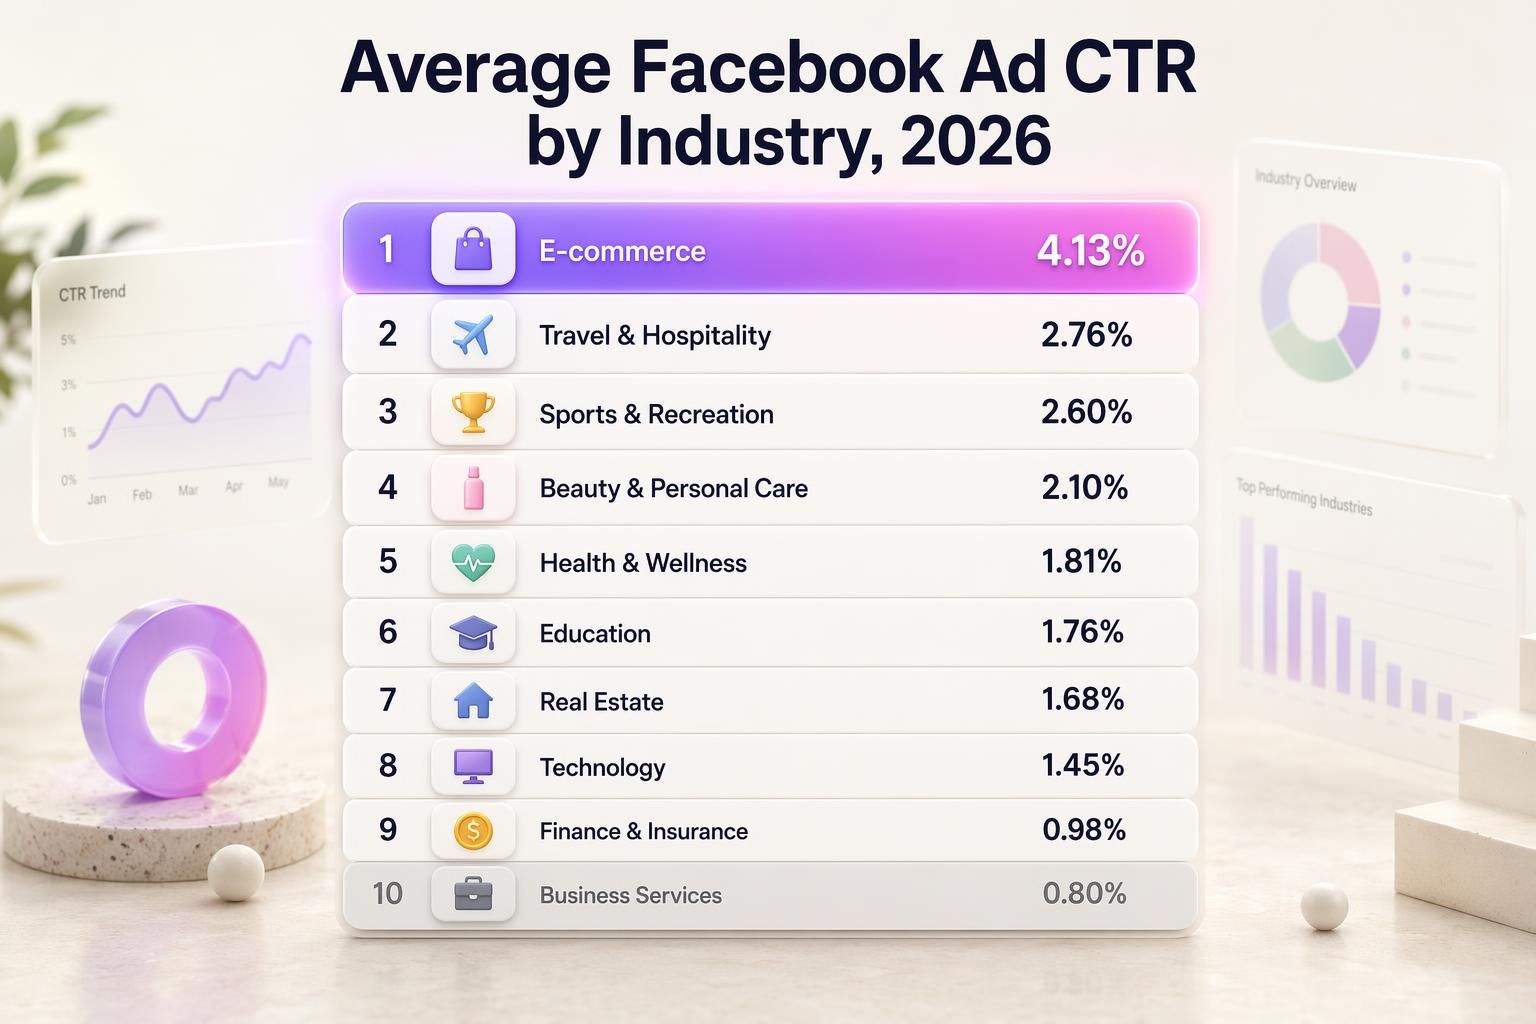
Facebook ad CTR ranges 0.80% to 4.13% by industry. The "1.71% all-industry average" is a real number, but a useless one. Industry, objective, placement, and Meta's March 3 attribution change move it more than your creative does. Here's the working benchmark sheet.
The Bottom Line: Headline is 1.71% for Traffic / 2.59% for Leads (WordStream 2025). Inside an industry, the top vs bottom decile spread is another 3x, and the gap between Meta's three CTR metrics (All, Link, Outbound) is 30-50%. Your real benchmark is industry + objective + placement, on post-March-2026 attribution.
1. The Headline Number (And Why It's Wrong For You)
Three sources published "the average" for the same year and got 0.89%, 1.71%, and 2.19%. Different samples, different metrics, different attribution windows. None are wrong. Match the source to your situation before quoting any.
| Source | Sample | Year | Avg CTR |
|---|---|---|---|
| WordStream / LocaliQ | 554 traffic + 726 leads campaigns, US | 2024-2025 | 1.71% Traffic / 2.59% Leads |
| Triple Whale | 35,000 ecom brands, $18.4B spend | 2025 | 2.19% (median) |
| Madgicx | $9B+ in spend | 2024-2025 | 0.89% (narrower metric) |
Why the same year shows 0.89% to 2.19%: WordStream measures traffic-objective Link CTR only, Triple Whale samples self-selected ecom optimizers, and Madgicx reports an all-clicks metric. Match sample + metric before you panic.
2. The Three CTR Metrics Meta Reports
Meta reports three click-through rates. Most advertisers compare the wrong one to the wrong benchmark.
CTR (All) counts every click on the ad: likes, reactions, comments, shares, saves, profile clicks, image expands, plus link clicks. Always the highest of the three.
Link CTR counts only clicks on links inside the ad (website, Facebook Event, Messenger, app store). This is the number most benchmark posts (including WordStream) report. Meta documents it at Meta Business Help: CTR Link.
Outbound CTR counts only clicks that take users off Meta entirely. Excludes on-platform link clicks like Messenger or Facebook Event. Usually 30-50% lower than CTR (All). Meta documents it at Meta Business Help: Unique Outbound CTR.
Practical rule: WordStream + Triple Whale benchmarks use Link CTR. Madgicx uses CTR (All). Keep the metric identical on both sides of the comparison.
3. Industry Benchmark Deep-Dive (The Big Table)
WordStream Traffic objective, all 21 industries, US (554 campaigns, Apr 2024 to Jun 2025).
| Industry | CTR | CPC |
|---|---|---|
| Shopping, Collectibles & Gifts | 4.13% | $0.34 |
| Travel | 2.76% | $0.51 |
| Sports & Recreation | 2.60% | $0.41 |
| Arts & Entertainment | 2.10% | $0.49 |
| Beauty & Personal Care | 1.81% | $0.74 |
| Attorneys & Legal Services | 1.76% | $0.86 |
| Personal Services | 1.70% | - |
| Real Estate | 1.68% | $0.91 |
| Restaurants & Food | 1.67% | $0.72 |
| Animals & Pets | 1.64% | $0.78 |
| Health & Fitness | 1.63% | $0.80 |
| Automotive - For Sale | 1.48% | $0.79 |
| Education & Instruction | 1.45% | $0.86 |
| Furniture | 1.39% | $0.85 |
| Business Services | 1.38% | $0.75 |
| Industrial & Commercial | 1.36% | $0.86 |
| Apparel / Fashion & Jewelry | 1.29% | $0.86 |
| Home & Home Improvement | 1.28% | $0.99 |
| Finance & Insurance | 0.98% | $1.22 |
| Physicians & Surgeons | 0.83% | $0.82 |
| Automotive - Repair & Parts | 0.80% | $0.81 |
Source: WordStream Facebook Ads Benchmarks 2025 / LocaliQ partner data. Overall average: CTR 1.71%, CPC $0.70.
For lead-gen campaigns the math shifts. Lead forms are on-platform and carry less click friction than going off-Meta.
| Industry | CTR | CVR | CPL |
|---|---|---|---|
| Arts & Entertainment | 3.92% | 9.34% | $18.17 |
| Real Estate | 3.75% | 9.53% | $16.61 |
| Sports & Recreation | 3.41% | - | - |
| Physicians & Surgeons | 3.02% | 4.51% | $47.47 |
| Restaurants & Food | 2.97% | 18.25% | $3.16 |
| Career & Employment | 2.81% | 5.77% | $17.64 |
| Beauty & Personal Care | 2.55% | 5.29% | $51.42 |
| Attorneys & Legal | 2.11% | 10.53% | $18.17 |
| Industrial & Commercial | 2.08% | 9.34% | $37.34 |
| Dentists & Dental Services | 1.05% | 6.38% | $76.71 |
Source: WordStream 2025. Overall: CTR 2.59%, CVR 7.72%, CPL $27.66 (up 20.94% YoY).
CTR by Campaign Objective
Objective shifts expected CTR by 3x. Compare like to like.
| Campaign Objective | CTR |
|---|---|
| Lead Generation | 2.53% |
| Traffic / Link Clicks | 1.57% |
| Engagement | 1.42% |
| Conversions | 1.38% |
| Video Views | 1.21% |
| Brand Awareness | 0.94% |
| Reach | 0.87% |
Source: Focus Digital 2026.
4. CTR by Placement
| Placement | CTR |
|---|---|
| Instagram Stories | 1.34% |
| Facebook Feed | 1.11% |
| Instagram Feed | 1.01% |
| Facebook Reels | 0.94% |
| Facebook Stories | 0.83% |
| Instagram Reels | 0.76% |
| Audience Network | 0.58% |
| Right Column | 0.41% |
Right Column at 0.41% is the worst placement on Meta. If your dashboard shows material spend there, exclude it. Audience Network at 0.58% is next. Both are common Advantage+ leaks.
5. Q4 CTR vs Q1 CTR
SuperAds 13-month CTR time-series across $3B in ad data, Jan 2025 to Jan 2026.
| Period | Avg CTR | Notes |
|---|---|---|
| Q1 2025 | 1.69% | February low of 1.65% |
| Q2 2025 | 1.75% | Stable spring lift |
| Q3 2025 | 1.89% | Back-to-school ramp |
| Q4 2025 | 2.02% | December peak of 2.10% |
| Jan 2026 | 2.08% | Held above 2% into the new year |
Source: SuperAds CTR time-series.
Q4 CTR runs ~20% above Q1, but CPMs run ~26% above and Black Friday hits 2-3x. The pop is intent, not skill. Hold your annual baseline.
6. The 2026 Stat Shift: Andromeda + March 3 Attribution Change
Every benchmark above was measured before Meta's March 3, 2026 attribution change. Comparing pre- and post-March CTR is a metric switch in disguise. Here's what shifted:
What changed on March 3, 2026
Before March: a "click" counted as a like, reaction, share, save, comment, image expand, or a 10-second video view. After March: only an actual link click that sends someone to your site, app store, or lead form counts toward click-through attribution.
Engaged-view was renamed to engage-through and the window collapsed from 7 days to 1 day. The practical effect: a conversion that happens 4 days after someone watched your video but didn't click now shows up in neither bucket and quietly disappears from your report.
Andromeda completed global rollout in October 2025
Meta's personalized ranking model uses a 10,000x larger neural net for ad retrieval (Confect Andromeda Study, 3,014 ecom advertisers, 73 countries). It picks the specific ad shown to each user from their individual behavior signals, not your targeting cluster.
Q1 2026 measurement-corrected CPA inflation was 15-30% with zero change in real conversions. Most of the March "performance drop" was a measurement change, not a real crash.
"In the Andromeda era, traditional CTR has lost predictive power. The algorithm prioritizes post-click value over click count. High-CTR ads can get suppressed if downstream signals show poor conversion."
- Paraphrased from Logical Position's 2026 Paid Social Playbook.
Practical move: if you're benchmarking March 2026 CTR against Feb 2026 CTR, you're comparing two different metrics with the same name. Reset your baseline using only post-March 15 data. For the full Andromeda playbook and the 9 levers that move CTR post-March, read our companion piece on the 9 creative levers.
7. Why Your CTR Looks Broken (A Diagnostic)
Three things that explain almost every "CTR is broken" ticket (the other common causes - wrong metric, wrong industry, post-Andromeda transition - are covered in sections 2, 3, and 6 above):
1. Creative fatigue
Frequency past 2.5 is the classic threshold. CTR drops 15-20% week-over-week from peak is the signature pattern. Source: Bir.ch's creative fatigue analysis. Fix: refresh the hook, not the whole ad - swapping the first 3 seconds extends fatigued creative by 30-40%. A common Reddit pattern: "CTR was 5% then dropped to 0.8% in week 4." The 5% was a cold-launch novelty number; the 0.8% is steady state.
2. Wrong placement mix
Your ads are running on Audience Network at 0.58% and Right Column at 0.41% and dragging the average. Open Breakdown by Placement in Ads Manager. If Audience Network is more than 5% of your impressions, exclude it from the placement mix.
3. First-frame failure
Your ad looks like an ad at t=0 (logo center, studio lighting, slow zoom). If the first frame reads as branded content, reach dies before the click. Related pattern: high CTR with zero conversions usually means hook misalignment - the ad promised something the landing page doesn't deliver. Better creative is worse when it pulls the wrong people, and the fastest way to confirm it is to check your conversion rate against the 2026 median for the same denominator.
Once you know your benchmark, the 9 creative levers that move CTR in the Andromeda era live in our companion piece on the 9 creative levers.
Frequently Asked Questions
Why did my Facebook ad CTR drop in 2026?
Three likely causes: Meta's March 3 attribution change narrowed what counts as a click; creative fatigue past frequency 2.5; Andromeda's rollout reshuffled audience routing. Reset your baseline using only post-March 15 data. Full Andromeda recovery playbook lives in our 9-lever CTR companion piece.
Does Instagram have a higher CTR than Facebook?
Aggregate, no - Facebook averages ~3.06% all-placement vs Instagram ~0.68%. But by placement, Instagram Stories (1.34%) beats Facebook Feed (1.11%). It's about placement mix, not platform (source: Focus Digital Social Media CTR Benchmarks).
What is a good CTR for Facebook Reels and Stories specifically?
Stories 0.83-1.34% (Instagram Stories highest at 1.34%). Reels 0.76-0.94%. UGC-style creator content can push Reels CTR to 3.8% per Marketing LTB's Reels CTR data. Standard branded Reels: under 0.5% is a hook problem, 1.5%+ is winning.
Beat your own baseline by 20% on the next refresh.
Generate 10-20 variants in one batch. Free credits, no card.
Related Resources
Higher CTR on Facebook Ads in 2026: 9 Creative Levers
The companion piece. Once you know your benchmark, here are the 9 levers that actually move CTR post-Andromeda.
The Creative Volume Wall
Why brands shipping 50 ads a week beat brands shipping 5. The math behind real creative volume.
Facebook Ad Image Sizes 2026
Every placement, every pixel - the spec sheet that prevents the wrong-placement CTR drag.
Make your next ad from what already runs
Research what competitors are running, then generate your own on-brand ads in minutes.