Social Media Impressions Explained: The Metric Everyone Reports and Nobody Understands
Impressions and reach are not the same. Paid impressions and organic impressions are not the same. Served vs viewable impressions are not the same. Here's the 2026 spec for every platform, what the IAB actually counts, and why your dashboard is lying to you.
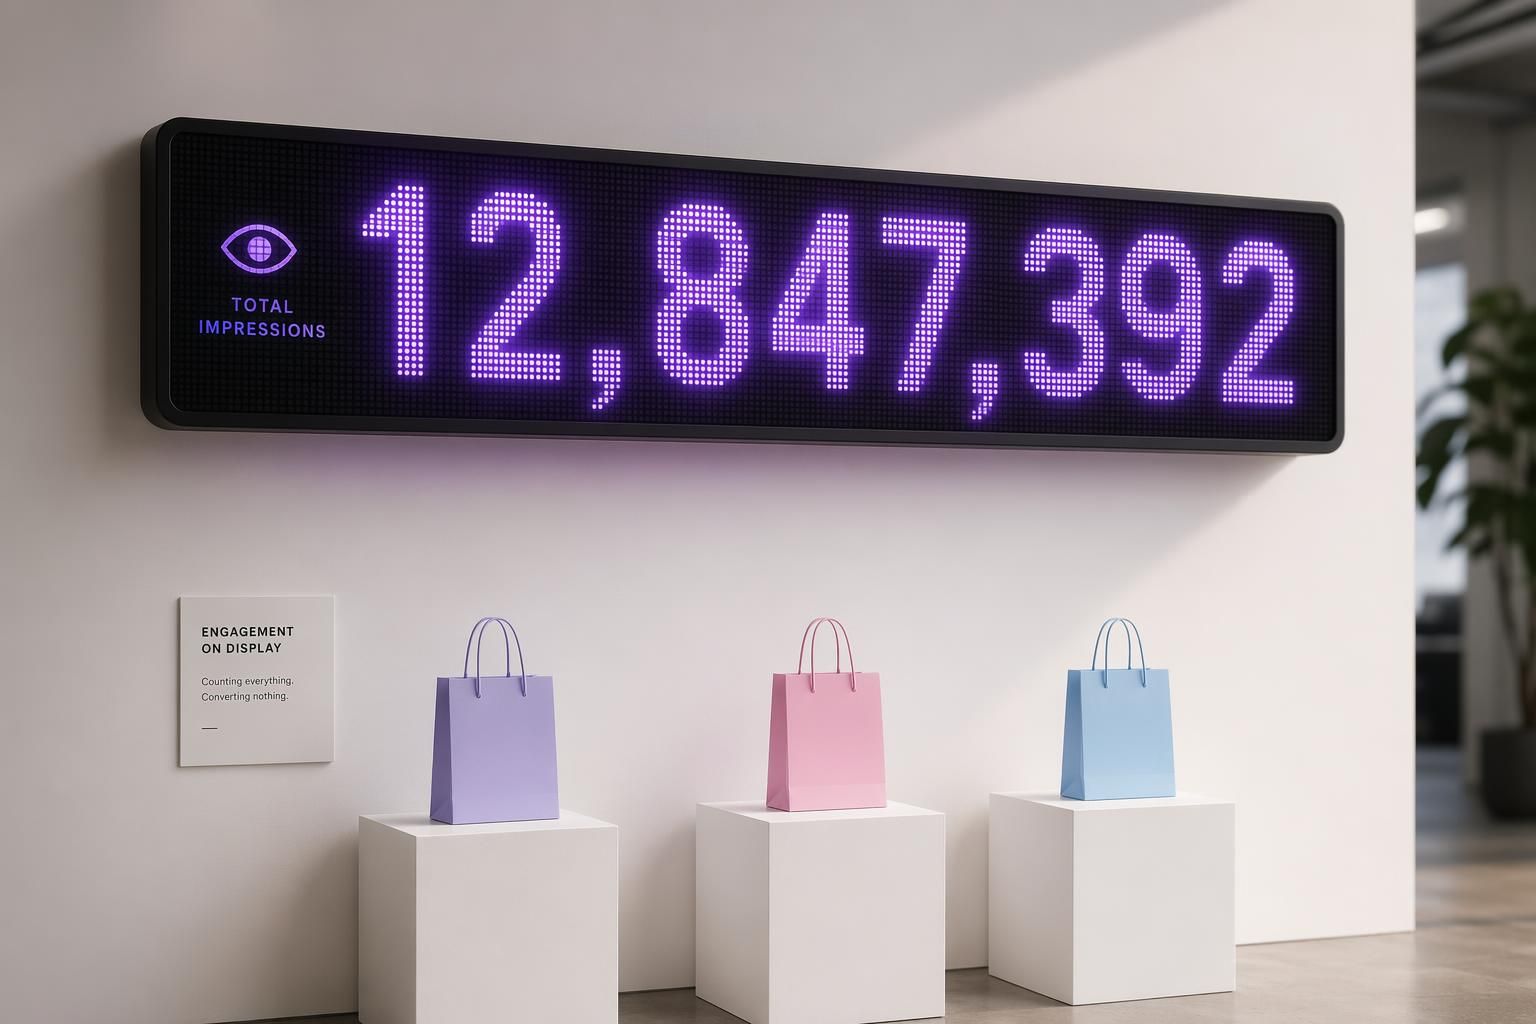
Your dashboard says 100,000 impressions this week. That number is not the number of people who saw your ad. It is total displays, often counted differently on every platform, often inflated by bots. Here is what it actually means and how to read it.
The Bottom Line: An impression is one display of your ad. Reach is unique people. Impressions divided by reach equals frequency. Each platform measures "display" differently, so a Meta impression and a LinkedIn impression are not the same metric. Per-platform rules and viewability data are below.
The math example that makes it click
You spend $500 on Meta for a week. The dashboard shows:
- Impressions: 50,000
- Reach: 10,000
- Frequency: 5.0
You did not reach 50,000 people. You reached 10,000 people 5 times each. Same dollar spend, very different story.
Per-Platform Definitions (The Cheat Sheet)
| Platform | What counts as an impression | Duration gate | Source |
|---|---|---|---|
| Meta (Facebook + Instagram) | Ad on screen for the first time. Invalid bot traffic filtered out. | None | Meta Business Help |
| Ad at least 50% in view (viewable impression standard) | 1 sec desktop, 300ms mobile | LinkedIn Help | |
| TikTok | Ad at least 50% visible on screen | 1 second | TikTok Ads Help |
| X (Twitter) | Tweet rendered on screen. Even a millisecond counts. | None | Sprout Social |
| Pin container has at least one pixel on screen | 1 continuous second | Pinterest Help | |
| Snapchat (Snap Ads) | Full-screen creative rendered to the user | None | Snapchat Help |
| Snapchat (Story Ads) | IAB viewable standard: 50% rendered, 1+ second | 1+ second | Snapchat Help |
| YouTube | Video thumbnail at least 50% visible | 1 second | YouTube docs |
| Google Ads | Ad shown on a search result page or Google Network site | None | Google Ads Help |
| IAB / MRC (display) | 50% of pixels in view | 1 continuous second | IAB MRC Guidelines |
| IAB / MRC (video) | 50% of pixels in view | 2 seconds | IAB Viewability |
Practical takeaway: LinkedIn impressions will be systematically lower than Meta impressions for equivalent delivery, because LinkedIn filters non-viewable inventory before printing the number. X is the most permissive: a single tweet can rack up multiple impressions on the same user through home timeline, retweet, and profile views.
How Platforms Define An Impression (Served vs Viewable)
"Displayed" has three definitions in active use:
| Term | What it means | Who uses it |
|---|---|---|
| Served impression | The ad pixel loaded into a page or feed slot. Visibility is not checked. | Open-exchange display, some legacy ad servers |
| Rendered / on-screen impression | The ad was on screen at least once. Most social platforms (Meta, X, TikTok) report this. | Meta, X, TikTok, Pinterest, Snap Ads, Google Ads |
| Viewable impression (IAB/MRC) | 50% of pixels on screen for 1 continuous second (display) or 2 seconds (video). | LinkedIn, Snapchat Story Ads, IAB-compliant DSPs |
Ask "served or viewable?" before accepting any impression number from a third party. The two can differ by 20-30% (IAB MRC guidelines). Large display ads (over 242,000 pixels) qualify at 30% in view for 1 second.
How often that bar is actually cleared, per the IAS 20th Media Quality Report:
83.9%
Global desktop video viewability (record high in 2025)
77.6%
Global mobile app display viewability
93.1%
CTV viewability (per earlier IAS data)
Translation: even on premium verified inventory, 16% to 22% of your impressions never met the IAB viewable bar. Worse on open-exchange display without verification.
Why Your Platforms Disagree (Meta vs GA4 vs Triple Whale)
Meta says 100K impressions. GA4 says 40K sessions from Meta. Triple Whale says something else. Three reasons these never line up:
1. Different definitions
Meta counts impressions (ad-on-screen). GA4 counts sessions (people who actually landed on your site). Two completely different things. Most impressions never become sessions because most people scroll past. Some sessions are not from the platform you think they are because of attribution leaks.
2. Different attribution windows
Meta defaults to 7-day click + 1-day view. GA4 defaults to last-non-direct click with a 30-day lookback. Triple Whale and Northbeam build their own multi-touch models. Every system is doing the math correctly, on different rules.
3. Different bot and quality filtering
Meta filters invalid traffic from its impression count up front (per Meta Business Help). GA4 has its own bot filtering. Open programmatic platforms rely on a separate IVT layer. None of these are identical filters. So the "clean" number is different at every stop.
Quick decision framework
Trust the platform for delivery metrics(impressions, reach, frequency, CPM). Trust analytics for behavior metrics (sessions, conversion rate). Trust a post-purchase survey for attribution truth. No single tool gives you all three.
If frequency keeps climbing, the lever is more creative, not more budget.
Ad Set Studio generates 10 variations per batch. Free credits.
Are Impressions "Real"? Bots, Ad Blockers, And The Honest Number
Roughly 1 in 5 global impressions show invalid-traffic signals (20.64% IVT in 2025, Fraudlogix; projected $41.4 billion in losses per Marketing Week; Spider AF puts up to 25-30% of digital ad budgets at risk). Three ways your impression count gets distorted:
Bots
Automated traffic clicking through ad slots. Meta and Google filter the obvious stuff in the walled gardens. Open-exchange inventory leaks much more (per Anura).
Ad blockers
Strip impressions before the pixel fires. Most platforms filter for this, but it caps your reachable inventory below what your audience model suggests.
Background tabs and minimized windows
A served impression with zero viewability. Filtered on platforms using IAB-viewable counting. Not filtered on Meta or X.
Impressions Are A Vanity Metric (When They Are, When They Aren't)
Impressions tell you your ad was displayed. They do not tell you anyone cared. A million impressions with zero clicks, engagement, or conversions is background noise, not performance.
When impressions do matter
- Top-of-funnel brand awareness campaigns with controls (brand lift studies, frequency cap, viewable-only buys)
- SOV (share of voice) tracking against named competitors
- Reservation buys where you actually paid CPM up front for guaranteed impression delivery
- CTV and OOH campaigns where the visual asset is the message and click-through is not the goal
When impressions are a vanity metric
- Any performance campaign where conversions exist as a metric
- Monthly reports that lead with impressions and bury ROAS
- Organic social where impression count is the whole pitch
- "Engagement rate" calculated as engagements divided by impressions, because impression denominators are platform-specific and not comparable
What To Measure Instead (The Better Stack)
| Metric | What it tells you | When to use it |
|---|---|---|
| CTR | Clicks divided by impressions. Engagement signal. | Creative testing, hook performance |
| CPM | Cost per 1,000 impressions. Cost efficiency on impression purchases. | Reach campaigns, day-over-day delivery tracking |
| CPA / cost per acquisition | Cost per actual conversion. The cost truth. | Performance campaigns at every funnel stage |
| ROAS | Revenue divided by ad spend. The ROI truth. | Direct response, ecommerce |
| Hook rate / thumb-stop ratio | 3-second video views divided by impressions. Creative signal for video. | Reels, TikTok, in-feed video ads |
| Hold rate | 15-second video views divided by 3-second video views. | Long-form video, narrative ads |
| Viewable impression rate | Viewable impressions divided by served impressions. | Reconciling agency reports, programmatic buys |
The Reach-Frequency Stack And Frequency Capping
Frequency is the lever that ties impressions to user experience. Rough working bands for paid social per Databox and Improvado:
Cold prospecting
3 to 5
Per user per week. Enough exposure to register the brand.
Mid-funnel
5 to 7
Per user per week. Warming up a known audience.
Retargeting
7 to 10
Per user per month. Most advertisers cap retargeting at 5-10 per month per Databox survey.
The recurring root cause of bad impression metrics (climbing frequency, falling CTR, climbing CPM) is too few creative variations. If you ship 10 ads a month, your dashboard mostly tracks the same 10 ads getting shown to the same people.
FAQ
What is a good number of impressions on social media?+
Do impressions cost money?+
How do I lower my ad frequency without lowering impressions?+
Frequency climbing? Ship more variations.
AdMakeAI generates 10 ad variations per batch from one product photo. Free credits, no card.
Related Reading
What Is CPM (Cost Per Mille)? The 2026 Benchmarks
The companion piece on what each impression actually costs by platform and industry.
Facebook Ads CTR Benchmarks 2026
The numerator side of the equation: what counts as a good CTR now and why most are below it.
The Creative Volume Wall
Why running 10 ads a month is the real reason your frequency is climbing and your impressions feel empty.
Why Winning Ads Die After 2 Weeks
Creative fatigue is the impression-quality killer that breaks every dashboard.
Make your next ad from what already runs
Research what competitors are running, then generate your own on-brand ads in minutes.