AI Infographic Ad Generator
Create data visualization style ads with statistics, icons, and clean info presentation. Perfect for products with quantifiable benefits.
Free to try • No signup required • Instant results


Upload up to 3 product images. The AI will analyze these to create your ad.
Drag & drop up to 3 images or click to upload
PNG, JPG, WEBP up to 10MB
Optional: Enter your website URL to automatically extract brand info.
Add specific details about style, audience, or creative direction.
2 free generations left. for more.
Generated Ad
Your generated ad will appear here
Upload product images and click Generate
Who Uses This Tool
See how businesses and creators use AI-generated ads to save time and money
Health & Supplement Brands
Supplements face a unique challenge: their benefits are invisible and their ingredients are complex. Infographic ads solve this by visualizing nutrient profiles, absorption rates, and clinical results in a format customers can understand and trust. From vitamins to protein powders, data visualization makes the intangible tangible.
📈 Supplement infographics increase conversion by 45%
Why businesses use it:
- Display ingredient lists without overwhelming
- Highlight certifications and testing standards
- Compare dosages to competitors visually
- Build trust with clinical trial data
Consumer Electronics
Tech products live and die by their specs, but raw numbers don't sell. Infographic ads transform battery life, processing power, and storage capacity into visual comparisons that justify your price point. Turn feature lists into compelling reasons to buy.
📈 Tech buyers spend 2.5x longer on visual spec sheets
Why businesses use it:
- Justify premium pricing with visible specs
- Make technical features accessible to all buyers
- Enable quick competitive comparison
- Reduce returns from misunderstood features

Beauty & Skincare
Modern skincare consumers are ingredient-savvy. They research actives, percentages, and clinical results before buying. Infographic ads present this data beautifully, combining scientific credibility with premium aesthetics that match your brand positioning.
📈 87% of skincare buyers research ingredients first
Why businesses use it:
- Display clinical study results professionally
- Highlight active ingredient concentrations
- Show before/after statistics visually
- Build credibility with dermatologist data
Food & Beverage
Health-conscious consumers scrutinize labels. Infographic ads let you highlight what matters most—protein content, sugar levels, organic certifications—in a format that's scannable and shareable. Perfect for clean label brands competing against processed alternatives.
📈 Clean label products with visual nutrition grow 2x faster
Why businesses use it:
- Make nutrition facts engaging and shareable
- Highlight clean ingredient lists
- Display certifications prominently
- Compare favorably to unhealthy alternatives
Example Transformations
See how product photos transform into lifestyle ads
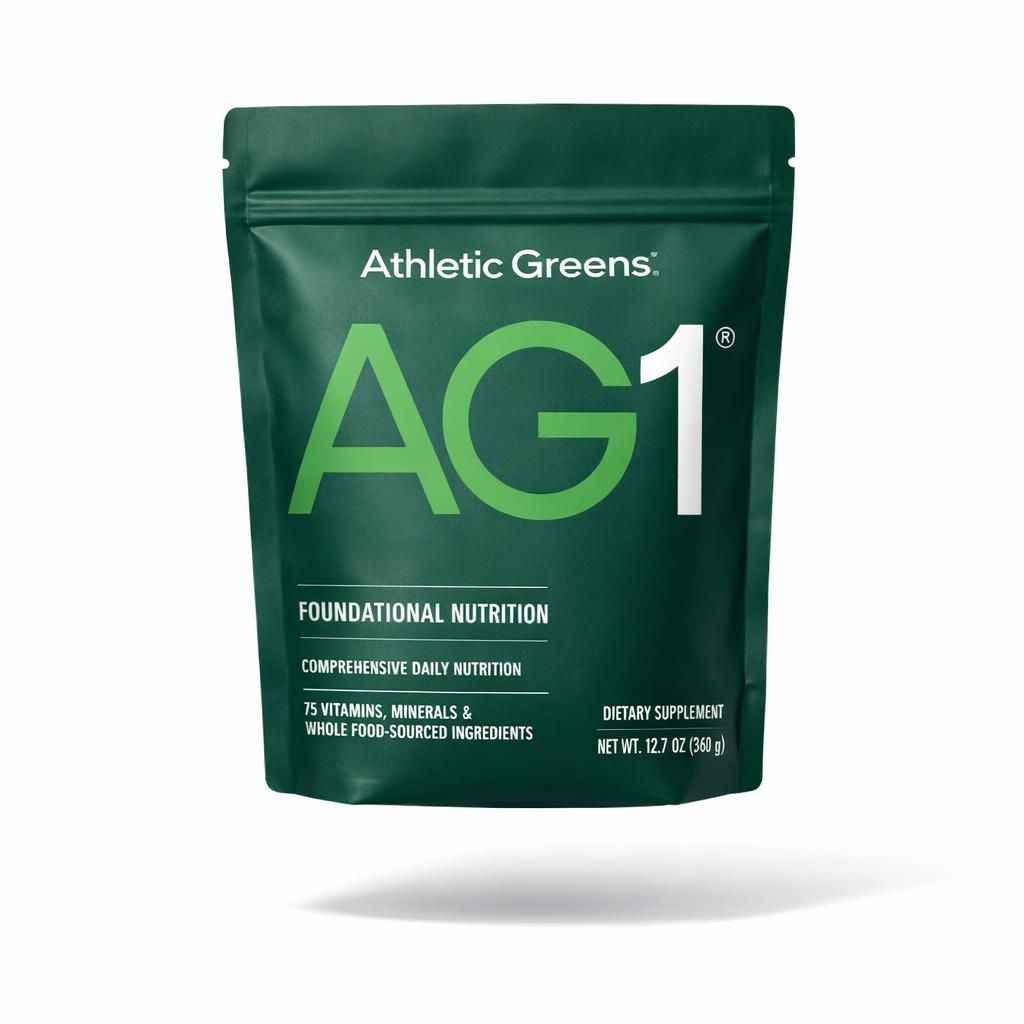
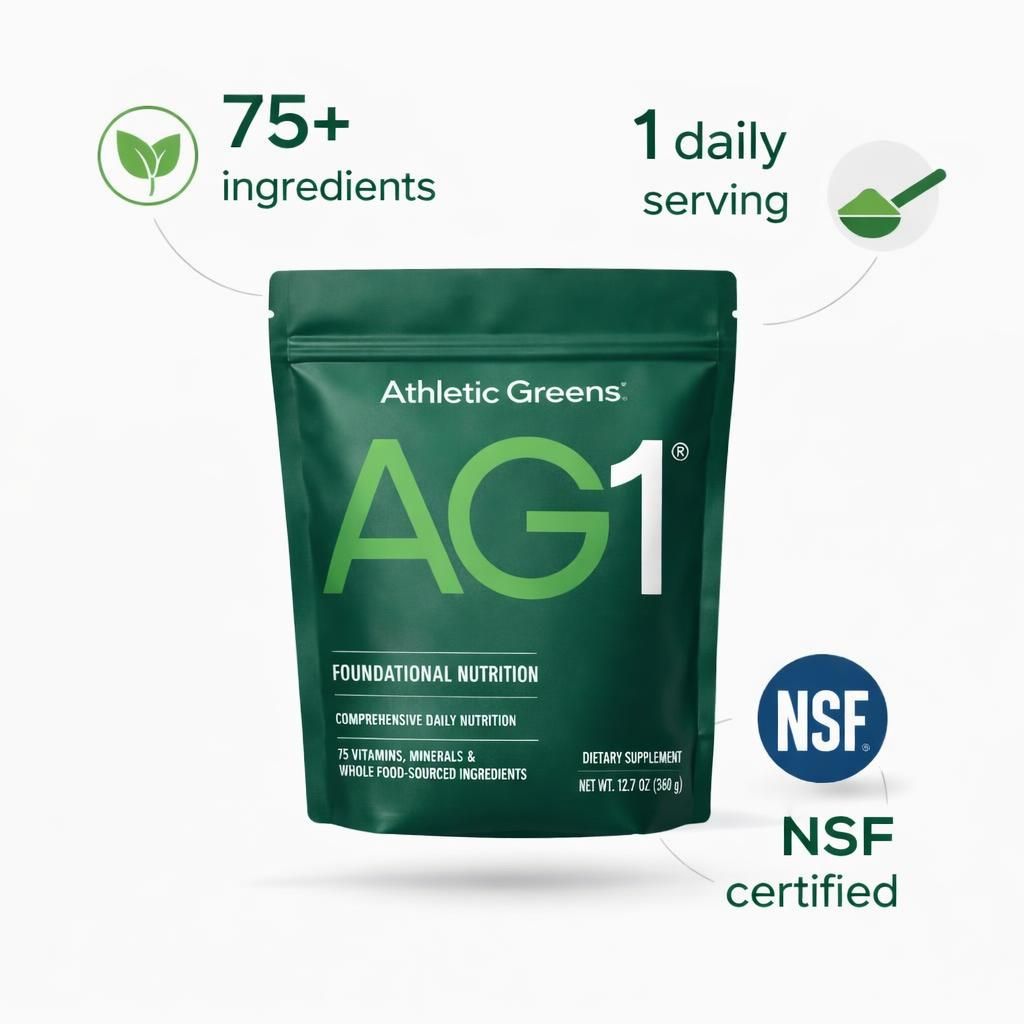
BeforeAfterAthletic Greens AG1
Athletic GreensHealth supplements sell on trust and efficacy. Infographic-style ads communicate complex nutritional benefits at a glance, making it easy for customers to understand your product's value proposition.
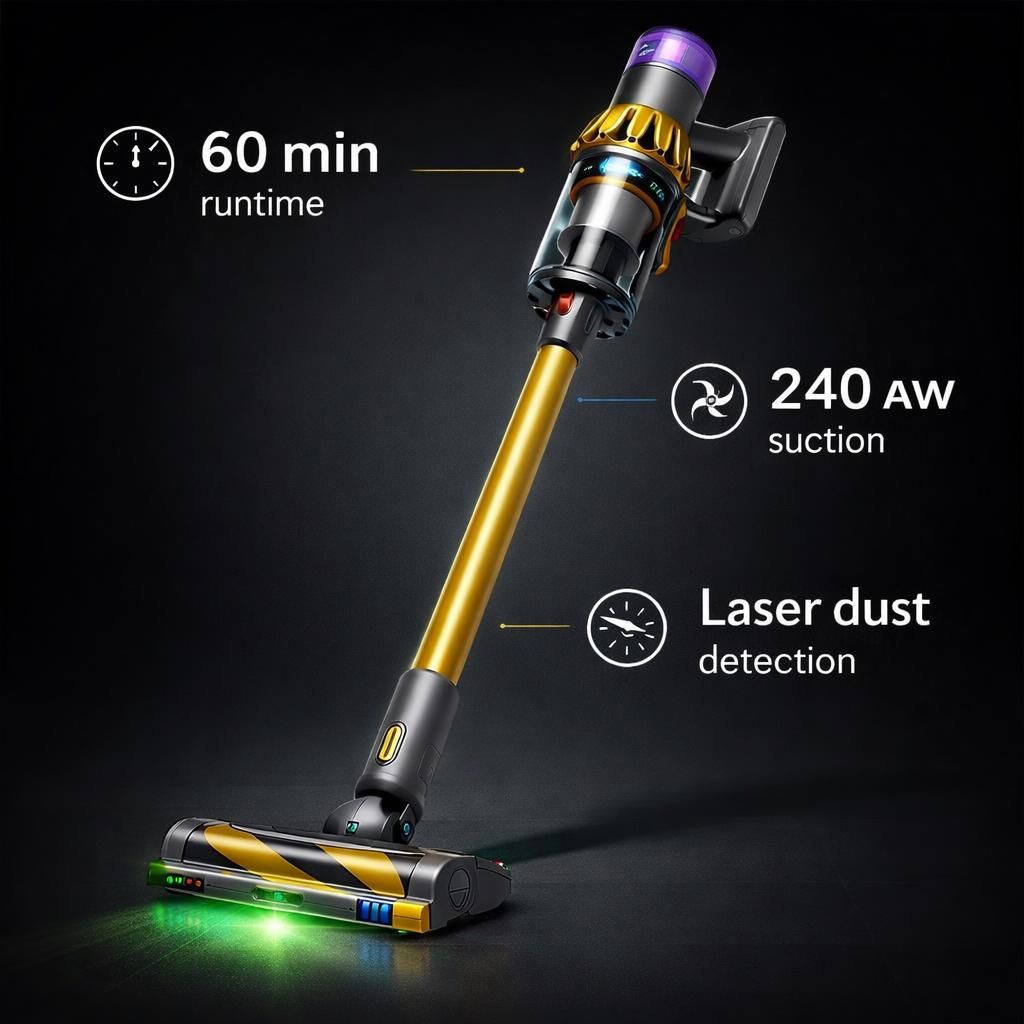
BeforeAfterDyson V15 Detect
DysonHigh-end tech products have impressive specs that often get lost in text. Infographic ads turn dry specifications into visual selling points that justify premium pricing.
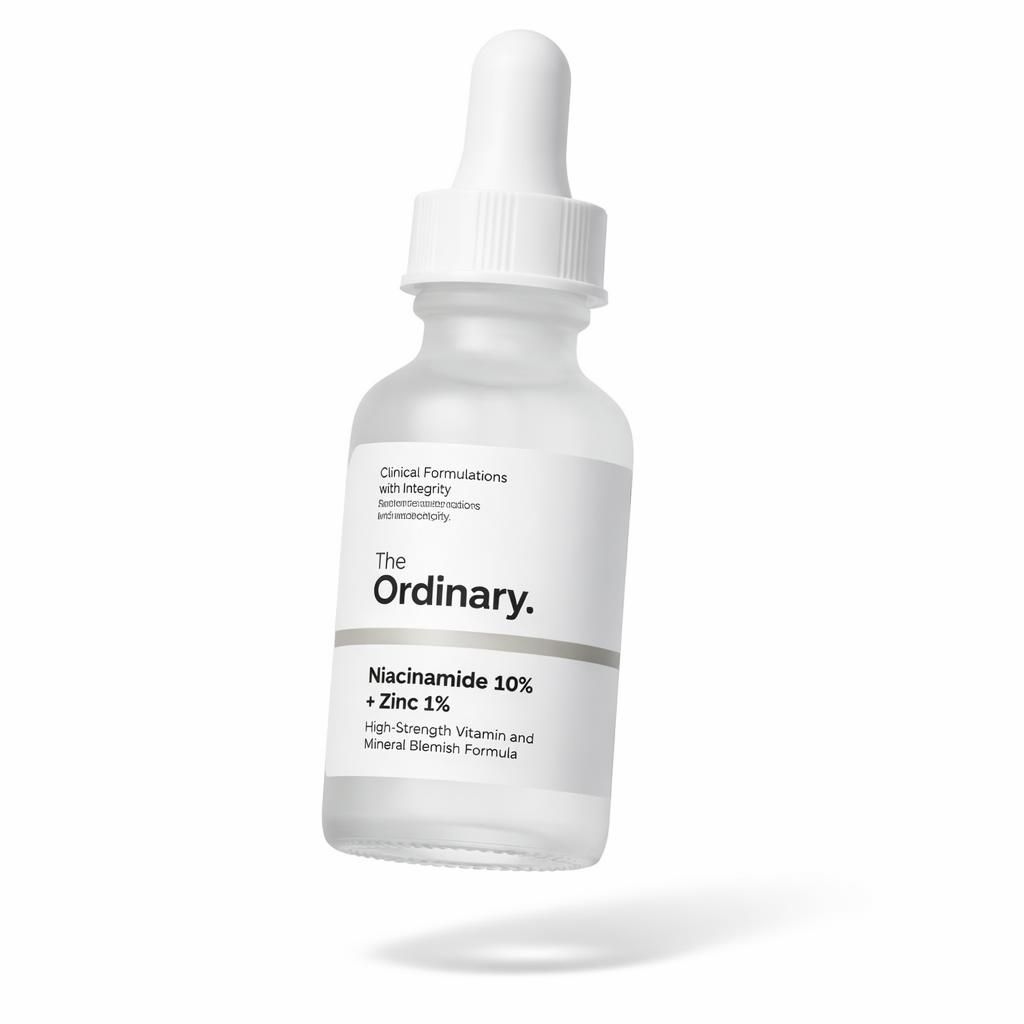
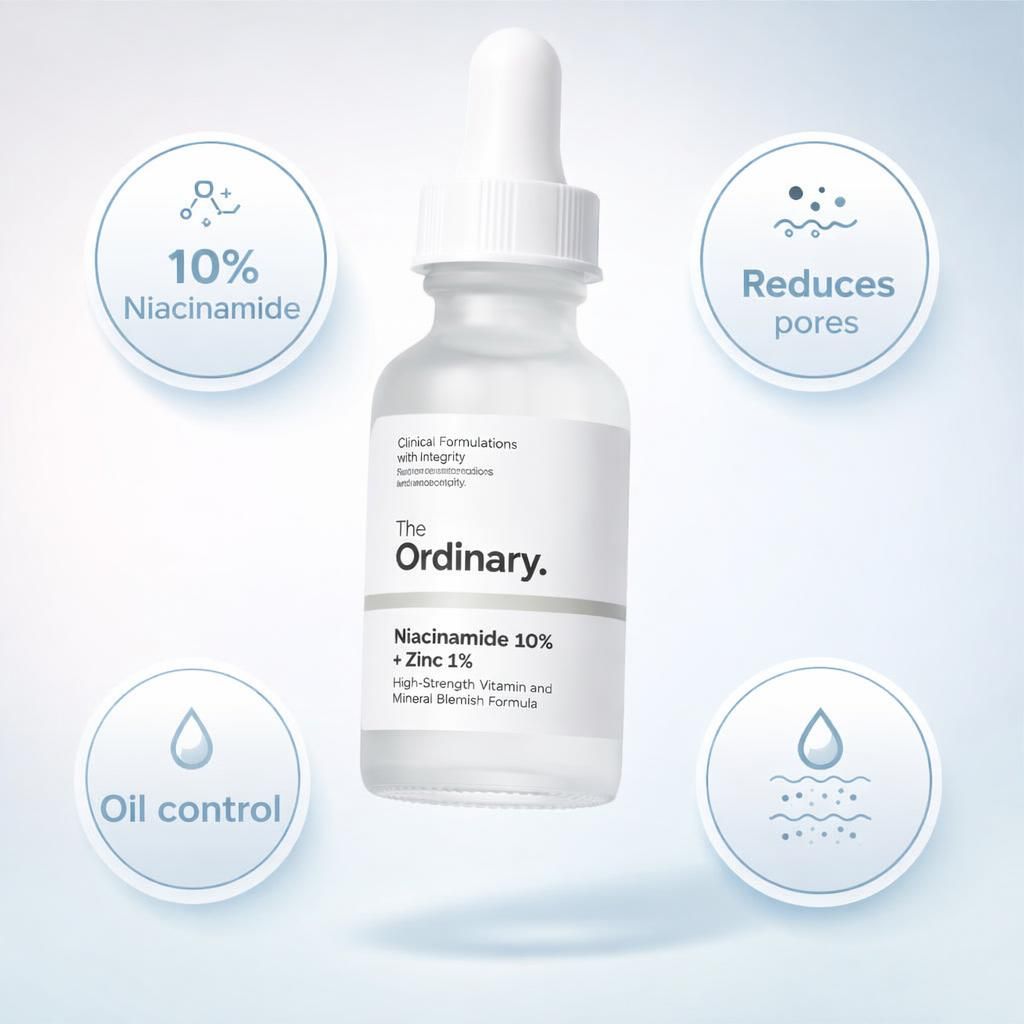
BeforeAfterThe Ordinary Niacinamide Serum
The OrdinarySkincare customers want proof. Infographic ads display clinical results, ingredient concentrations, and efficacy stats in a format that builds trust while looking premium.
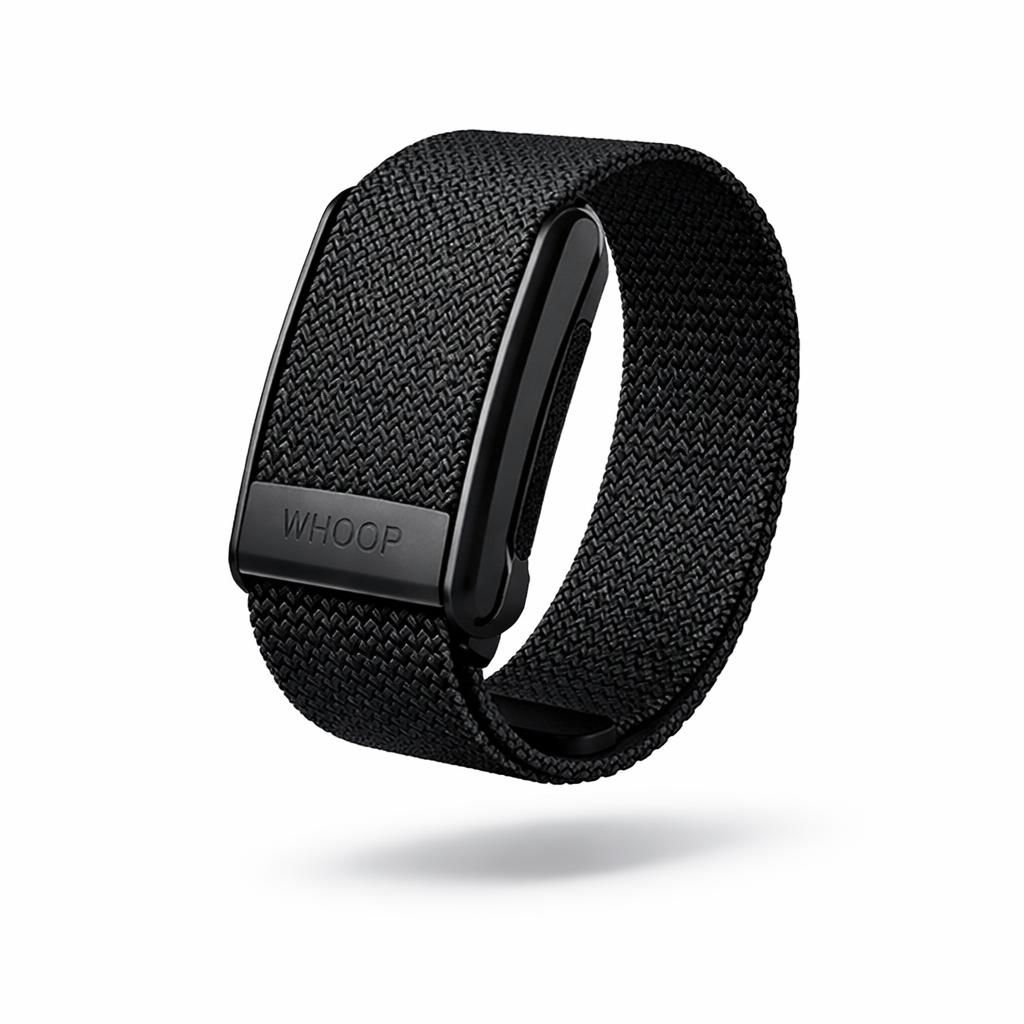
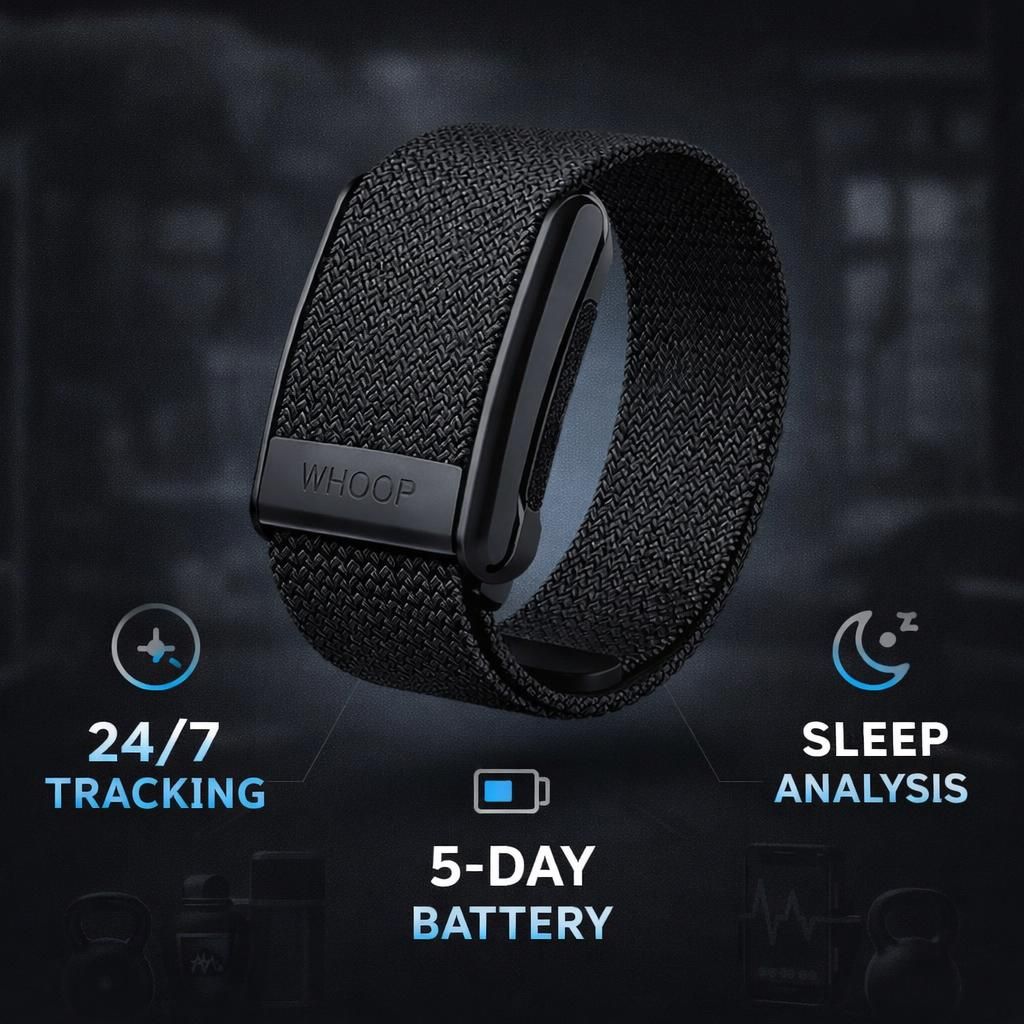
BeforeAfterWhoop 4.0
WhoopFitness wearables compete on features. Infographic-style ads make tracking capabilities tangible and comparable, helping customers understand what makes your device special.
 Before
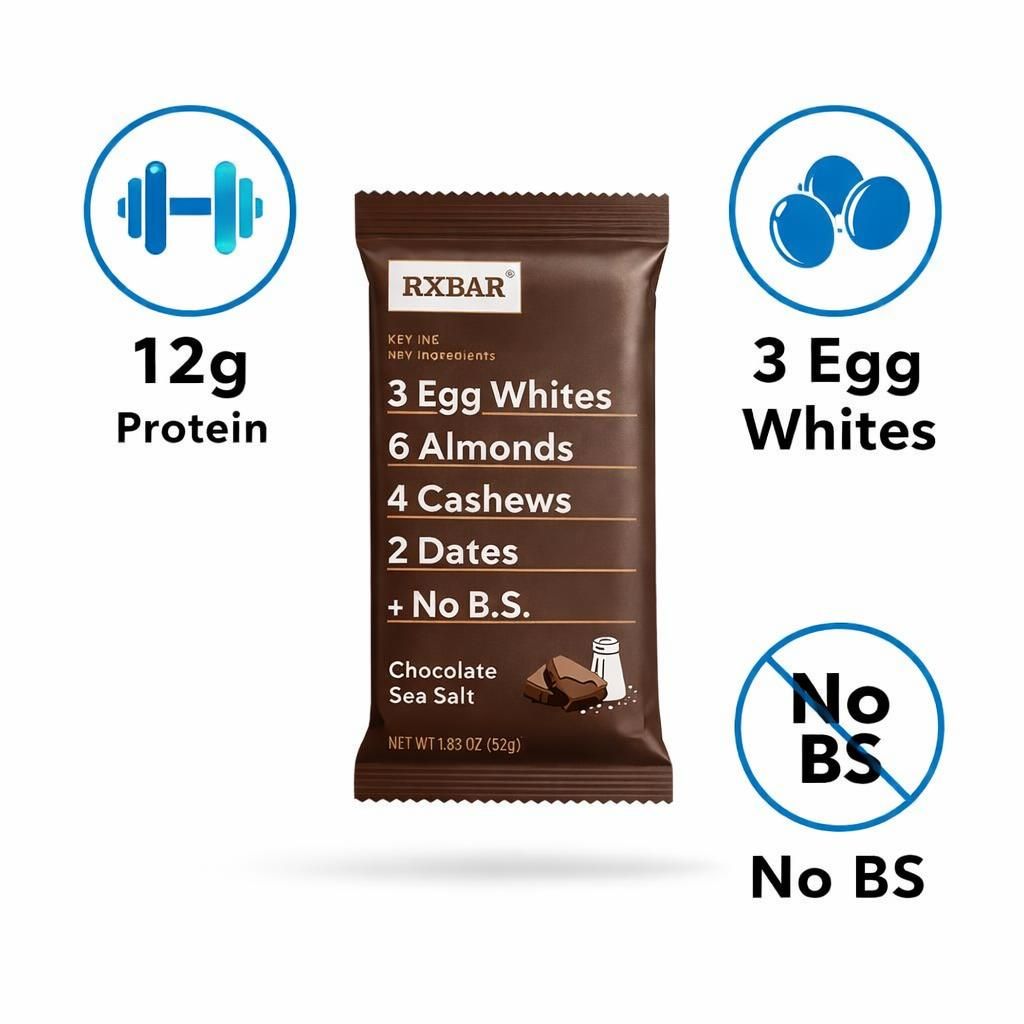 After
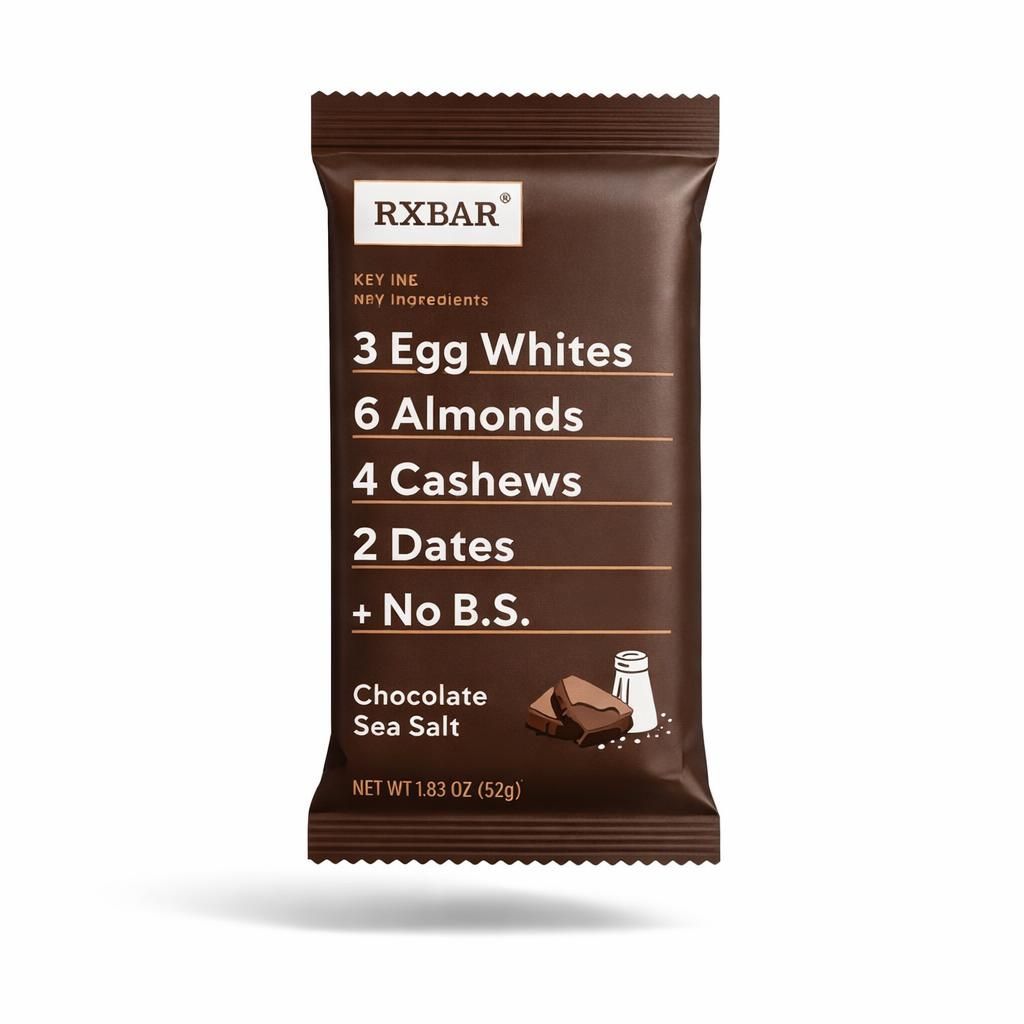
AfterRXBAR Protein Bar
RXBARClean label products win on transparency. Infographic ads let you display simple ingredient lists and nutritional facts prominently, appealing to health-conscious consumers.
 Before
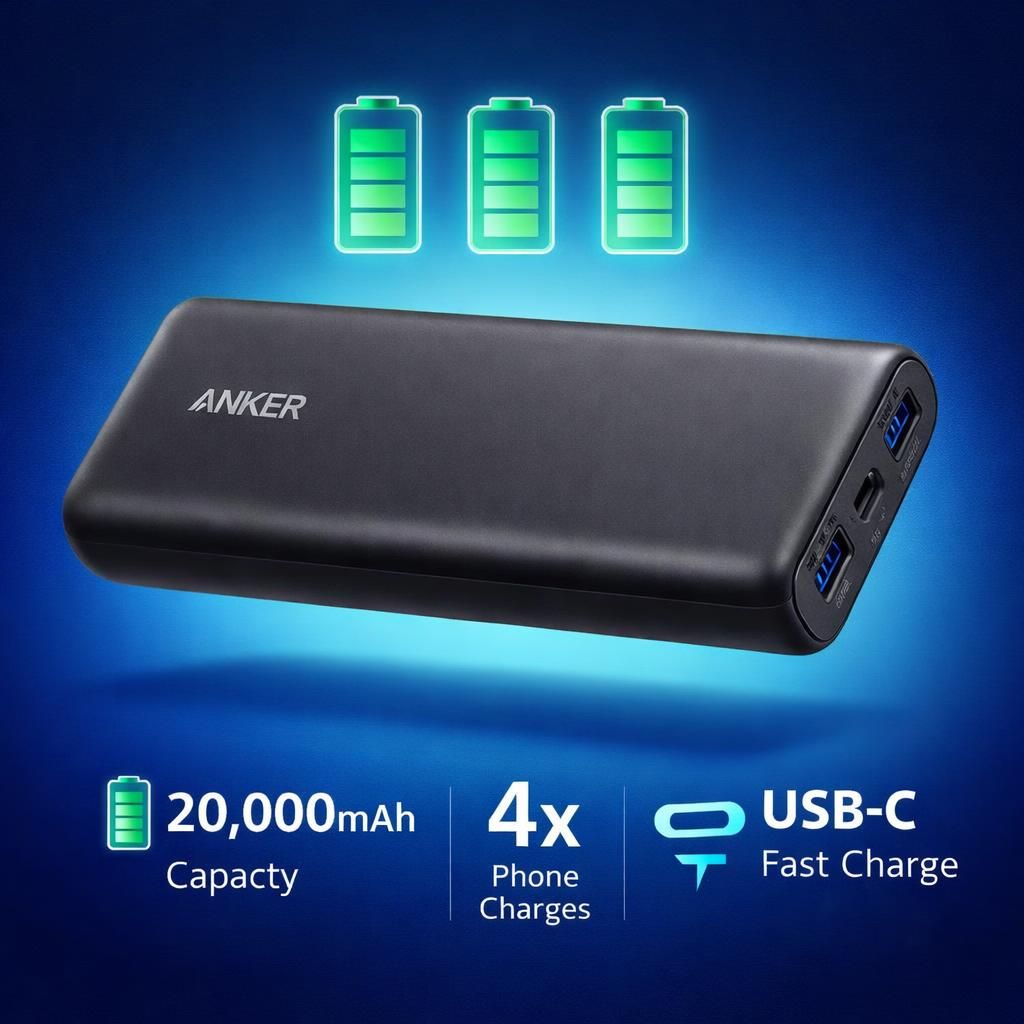 After
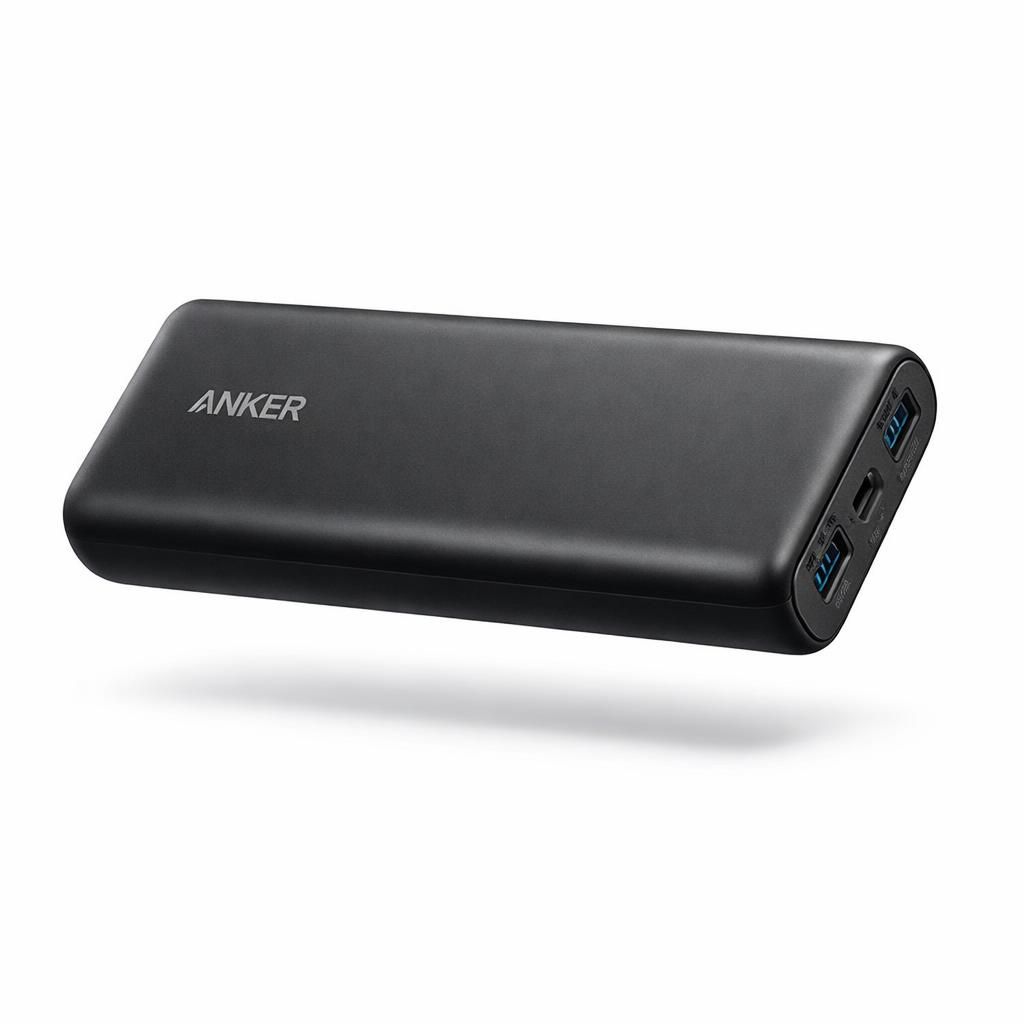
AfterAnker PowerCore
AnkerBattery capacity is meaningless to most consumers. Infographic ads translate technical specs into real-world usage, making abstract numbers relatable and compelling.
AI vs Traditional Methods
See how AI-powered ad creation compares to traditional approaches
| Feature | Traditional | With Infographic Ad |
|---|---|---|
| Cost per infographic | $200-500+ per design | ~$0.50 per image |
| Turnaround time | 3-7 days with revisions | Under 2 minutes |
| Design expertise needed | Requires professional designer | No design skills needed |
| Variations for A/B testing | Additional cost per variation | Generate unlimited variations |
| Product spec updates | Redesign required for changes | Regenerate with new specs instantly |
| Brand consistency | Depends on designer availability | Consistent style every time |
Frequently Asked Questions
Common questions about the Infographic Ad
Ready to create more ads?
Sign up for free and get credits to generate unlimited ads